 |
|
|
|
Washington University Environmental Indicators
►
ENERGY SAVING
INITIATIVES
►
SUSTAINABILITY
AT WASHINGTON UNIVERSITY
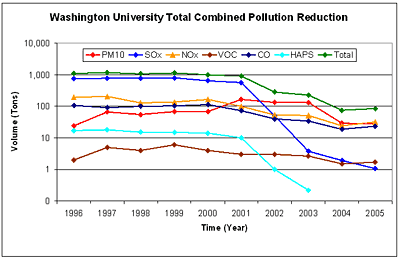
AIR QUALITY INDICATORSMost criteria
pollutants have decreased in concentration steadily.
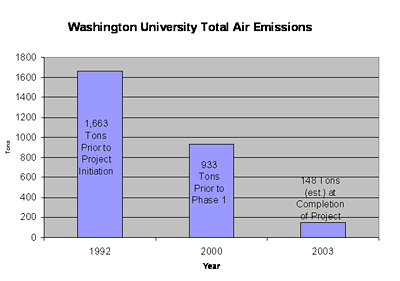
The total air emissions from WU sources
have also decreased by 94% over the last 10 years.
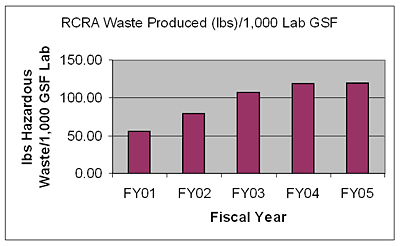
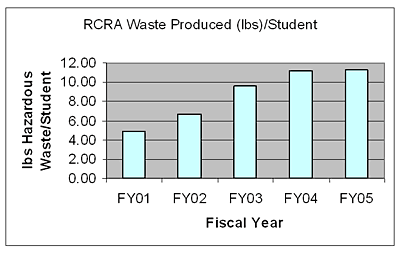
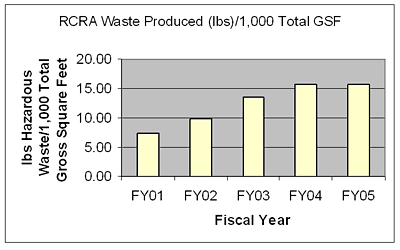
The total RCRA Waste Produced per
individual has increased due to increased research and other activities.
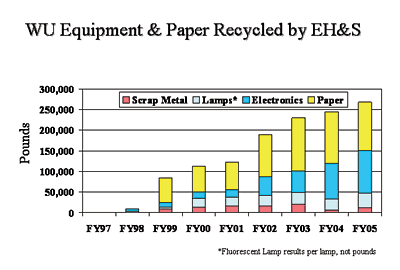
The total mass of equipment and paper
recycled at WUStL has also increased by 150% over the last 5 years.
EPA
Environmental Footprint Numbers for Washington University (last 5
years) |
|
|
|
|
|
|
|
|
|
|
FY01 |
FY02 |
FY03 |
FY04 |
FY05 |
| Total # Students |
12,191 |
12,750 |
13,045 |
13,386 |
13,690 |
| Total # On-Campus Students |
3,416 |
3,607 |
3,844 |
3,897 |
4,044 |
| Total # Students, Faculty & Staff |
22,487 |
23,380 |
23,058 |
23,972 |
24,313 |
| Lab GSF |
1,066,242 |
1,080,681 |
1,168,880 |
1,263,119 |
1,287,803 |
| Total GSF |
8,194,670 |
8,689,507 |
9,317,202 |
9,518,702 |
9,853,977 |
| Acres |
221 |
221 |
221 |
227 |
227 |
| Operational Expenditures ($) |
$1,134,357,000 |
$1,212,667,000 |
$1,328,500,000 |
$1,418,897,000 |
$1,515,370,000 |
| Research Expenditures ($) |
$295,925,000 |
$304,145,000 |
$343,708,000 |
$369,645,000 |
$393,840,000 |
| Total kWh Energy Used |
497,351,335 |
572,247,335 |
640,172,622 |
626,610,955 |
628,074,646 |
| Total Steam (1000 lbs) |
751,108 |
620,938 |
767,707 |
709,748 |
790,498 |
| Total Tons Chilled Water |
89,876,009 |
88,045,174 |
95,978,050 |
84,644,384 |
87,083,704 |
| RCRA Waste Recycled (lbs) |
0 |
0 |
0 |
3,812 |
8,100 |
| RCRA Waste Produced (lbs) |
59,758 |
85,542 |
125,736 |
149,421 |
153,994 |
| Total Universal Waste Recycled (lbs) |
39,477 |
53,868 |
40,460 |
84,731 |
175,944 |
| Tons Solid Waste Recycled |
33 |
51 |
73 |
63 |
57 |
| Tons Solid Waste |
12,722 |
14,141 |
15,436 |
16,320 |
15,781 |
| Total Potable Water (Thousand of Gallons) |
712,825 |
743,264 |
724,871 |
686,517 |
620,187 |
|
|
|
|
|
|
|
FY01 |
FY02 |
FY03 |
FY04 |
FY05 |
| RCRA Waste Produced (lbs)/1,000 Lab GSF |
56.05 |
79.16 |
107.57 |
118.30 |
119.58 |
| RCRA Waste Produced (lbs)/1,000 Total GSF |
7.29 |
9.84 |
13.50 |
15.70 |
15.63 |
| RCRA Waste Produced (lbs)/Student |
4.90 |
6.71 |
9.64 |
11.16 |
11.25 |
| RCRA Waste Produced (lbs)/On-Campus Student |
17.49 |
23.72 |
32.71 |
38.34 |
38.08 |
| RCRA Waste Produced (lbs)/$1M Research Funding |
201.94 |
281.25 |
365.82 |
404.23 |
391.01 |
| Total kWh Energy Used/Person |
22,117 |
24,476 |
27,764 |
26,139 |
25,833 |
| Danforth Campus Total kWh Energy Used/Person |
12,799 |
13,295 |
14,199 |
14,035 |
13,988 |
| Medical School Total kWh Energy Used/Person |
39,851 |
46,111 |
57,169 |
51,274 |
50,748 |
| Total kWh Energy Used/Total GSF |
61 |
66 |
69 |
66 |
64 |
| Danforth Campus Total kWh Energy Used/Total
GSF |
44.79 |
44.97 |
44.64 |
45.20 |
43.82 |
| Medical School Total kWh Energy Used/Total
GSF |
77.52 |
88.89 |
96.80 |
88.88 |
86.54 |
| 1000 lbs Steam/Total GSF |
0.092 |
0.071 |
0.082 |
0.075 |
0.080 |
| Danforth 1000 lbs Steam/Total GSF |
0.033 |
0.037 |
0.038 |
0.038 |
0.037 |
| Medical School 1000 lbs Steam/Total GSF |
0.154 |
0.109 |
0.135 |
0.115 |
0.129 |
| Tons Chilled Water/Total GSF |
10.97 |
10.13 |
10.30 |
8.89 |
8.84 |
| Danforth Tons Chilled Water/Total GSF |
5.42 |
6.70 |
7.84 |
8.31 |
8.52 |
| Medical School Tons Chilled Water/Total GSF |
16.84 |
13.92 |
13.17 |
9.54 |
9.20 |
| Percent Solid Waste Recycled |
0.26% |
0.36% |
0.47% |
0.39% |
0.36% |
| Danforth % Solid Waste Recycled |
Not recorded |
Not recorded |
Not recorded |
Not recorded |
Not recorded |
| Medical School % Solid Waste Recycled |
2.88% |
1.99% |
1.91% |
1.48% |
1.54% |
| Potable Water/Person/Year (In Thousands of
Gallons) |
31.70 |
31.79 |
31.44 |
28.64 |
25.51 |
| Danforth Potable Water/Person/Year (1000 Gallons/person/year) |
17.26 |
17.46 |
17.87 |
16.86 |
16.01 |
| Medical School Potable Water/Person/Year (1000
Gallon/person/year) |
59.19 |
59.52 |
60.85 |
53.09 |
45.49 |
| Potable Water/Total GSF (In Thousands of Gallons) |
0.087 |
0.086 |
0.078 |
0.072 |
0.063 |
| Danforth Potable Water/Total GSF (1000 Gallons/GSF) |
0.060 |
0.059 |
0.056 |
0.054 |
0.050 |
| Medical School Potable Water/Total GSF (1000
Gallon/GSF) |
0.115 |
0.115 |
0.103 |
0.092 |
0.078 |
|
|
|
|
|
|
|
 |
Environmental & Energy Research
© 2006 Washington University in St. Louis |
|